
On Thursday I ran every US-listed company worth more than $2 billion through the valuation methods I built for my own personal investment analysis, where I normally point them at salmon farmers. The S&P 500 had slipped 6.6% from its 6 October high, people around me had started to use the word correction, and I wanted to know whether this was one of the rare moments when good businesses go on sale.
The line in my head was Warren Buffett’s, from his 1989 letter, that it is far better to buy a wonderful company at a fair price than a fair company at a wonderful price. He gave Charlie Munger the credit for teaching him that. The harder question is whether you ever get both, a wonderful company at a wonderful price.
The short answer is that the market is not on sale, but parts of it are. Of the 1,734 companies I screened, 267 pass a strict quality test, and only 19 of those trade at a discount of 20% or more on both measures I used. Take out the cyclicals and the accounting quirks and five are left, and with two that just miss the cut I have seven names worth serious study. Every one of them comes with a specific fear attached, and I have come to think the fear is the real subject of the analysis, not the discount.
A calm index over a real correction
Start with the numbers as they stood when I took my snapshot during trading on 19 November. The S&P 500 tracker, SPY, was at $727.70, which is 6.6% below the record close of 6 October and still about 10% above where it was a year ago. The index kept falling after my snapshot and closed the day about 2% lower, its sixth fall in a row, roughly 8% below the high.
The Shiller CAPE was around 41 in reports from July and September, a level last seen in 2000. After the fall it reads somewhere between 38 and 41 depending on who computes it, and one tracker that had it at 38.8 on 12 November still ranks that above 98% of all months since 1881, against a long-run median near 17. On forward earnings the picture is milder. FactSet put the forward P/E at 17.7 on 5 November, the lowest since November 2023 and below its five- and ten-year averages, though still a little above the 15- and 20-year averages. The two measures disagree because CAPE looks back over ten years of earnings and the forward P/E leans on what analysts expect next year.
None of that sounds like a sale. Below the index it is a different market. The median stock in my 1,734 is 18% below its 52-week high. More than a third of them, 36%, are down 25% or more, and 17% are down 40% or more.


Read those numbers together and you see a handful of giant companies holding the index up while a third of the market has fallen hard. Most of us in Iceland who own American shares own them through an index fund or a pension fund, and the statement we get shows a small dip. The index is not telling us what happened to the typical company.
Munger never tried to call the market as a whole. He waited for individual businesses he understood to become cheap. So that is what I went looking for.
The rules came before the results
I wanted something a reader could reproduce, so I wrote the rules down first.
The universe is every issuer on the NYSE and Nasdaq from the SEC’s company list, about 7,600 tickers, cut down to companies worth more than $2 billion that report in US dollars. That leaves 1,734. The fundamentals come from up to ten years of each company’s annual reports as first filed with the SEC, and the prices from Yahoo Finance.
A business has to pass at least five of six checks to count as quality. Its after-tax return on invested capital has to average 10% or more. It cannot have had a loss year. Its operating margin has to average at least 8%, and that margin cannot swing wildly, because a stable margin is the best sign of pricing power I know of in a filing. Its free cash flow has to be at least 70% of reported net income. The sixth check is mandatory: net debt no more than three times EBITDA, with interest covered at least four times.
I left out banks and insurers. Operating margin and return on capital mean nothing for a lender, the raw screen showed “operating margins” above 1,700% for some of them, and I worked inside a bank for long enough to know its accounts need a different exercise, built on book value and return on equity.
Two ways to look at a price
The first lens is Benjamin Graham’s margin of safety. I estimate what Buffett calls owner earnings, which is net income plus depreciation minus the capital spending needed to keep the business as it is, value them at about 16.7 times, and compare that with the share price. I do it once on the last fiscal year and once on the five-year average, and I rank each company on the worse of the two so that one good year cannot make it look cheap.
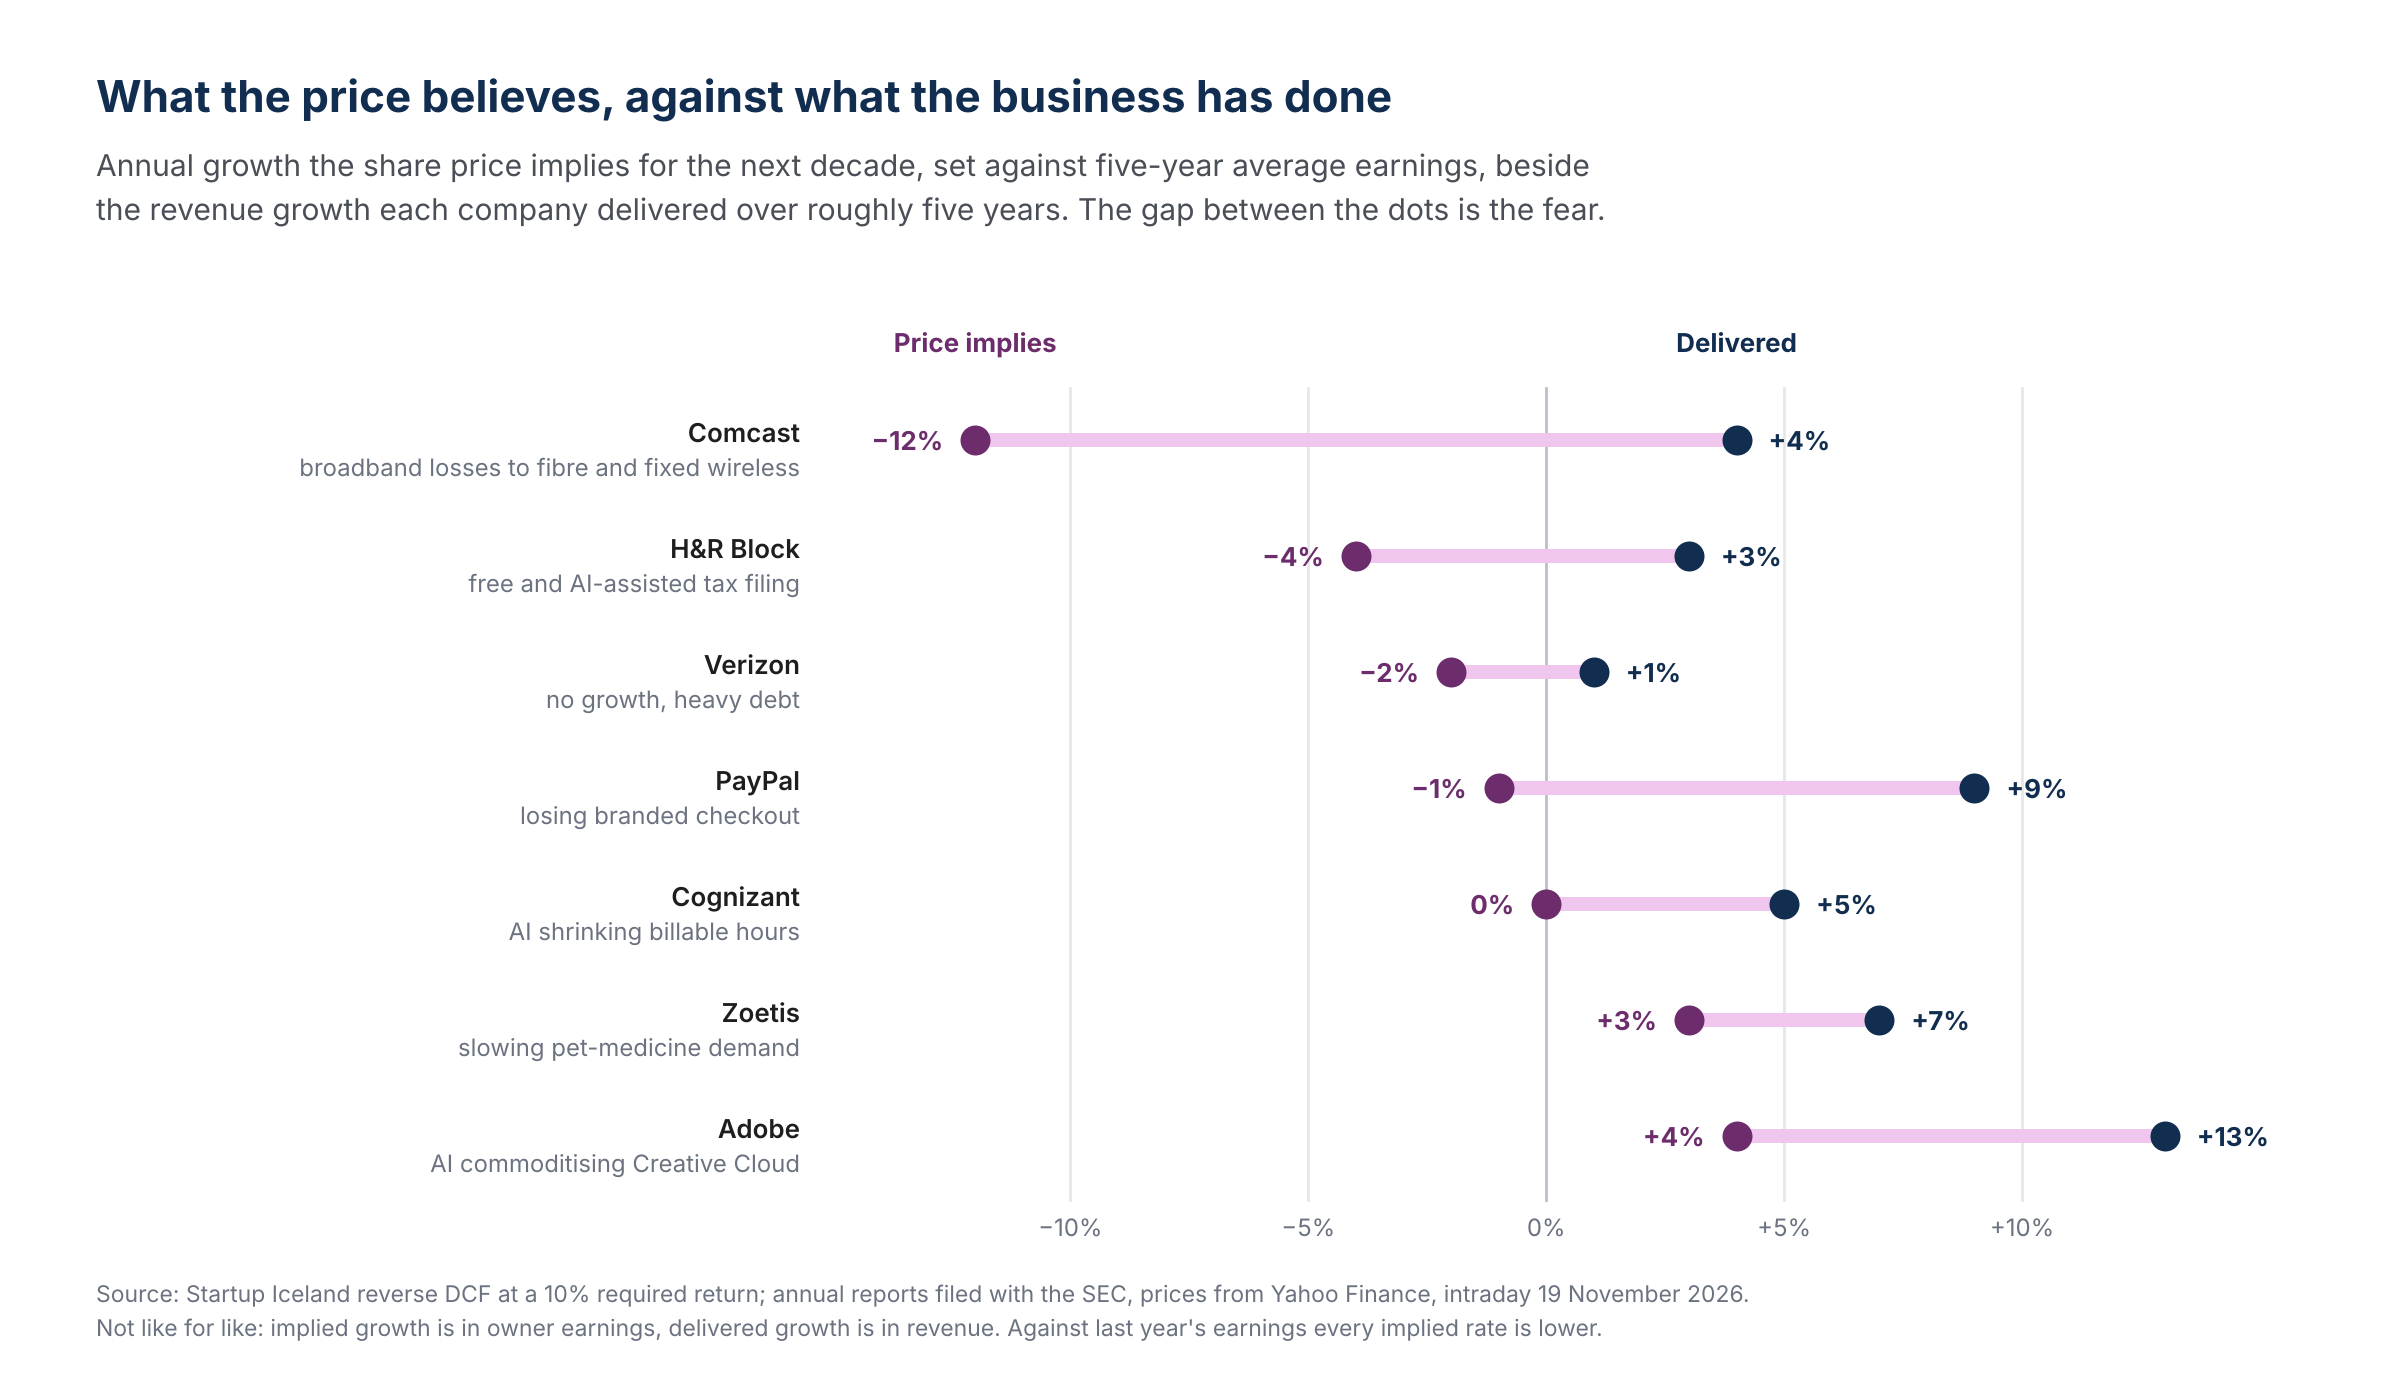
The second lens is Munger’s, and it runs the calculation backwards. Instead of asking what the company is worth, I ask what the price already assumes. If I need a 10% annual return, how fast must owner earnings grow over the next decade to justify today’s price? Then I put that next to what the business has actually delivered.
I would argue the second lens is the more useful one. “Adobe trades at about 12 times earnings” is a statistic. “The market expects Adobe to grow 4% a year” is a claim, and a claim is something you can argue with.
Nineteen out of 267
Of the 267 non-financial businesses that pass the quality test, 19 trade at a discount of 20% or more on both views. That is about 7%, in a market where the median stock is down 18%.


Then the list starts to fall apart, and this is the part most screens never show you.
Seven of the 19 are businesses whose earnings swing with a cycle, so that neither last year nor the five-year average tells you what they normally earn: Hafnia in product tankers, Rio Tinto in mining, Pilgrim’s Pride in chicken, Eagle Materials in cement, Cabot in chemicals, Lear and LCI in vehicle parts. Anyone who follows salmon knows this trap. A farmer looks cheapest in the year the spot price peaks, because the earnings in the denominator are the top of a wave, and paying 16.7 times those earnings is how you lose money in a good company. Munger did buy cyclicals, but against what they earn through a cycle, never against last year.
Two more, Harley-Davidson and Academy Sports, earned well below their five-year average last year, so the larger of their two discounts rests on a past they may not get back.
Four are cheap only because of how the accounts fall. Boyd Gaming shows an 82% discount because net income jumped from $578 million in 2024 to $1.8 billion in 2025, and $1.4 billion of that was the after-tax gain on selling its 5% stake in FanDuel. Take it out and the discount disappears. Bath & Body Works and HP have negative or tiny shareholders’ equity, which makes return on capital look spectacular, HP shows 319%, and both are mature businesses. The fourth is Solventum, and it shows the quirk no screen can see, the company that is no longer the company in its annual report. Solventum sold its purification and filtration business to Thermo Fisher in September 2025, so its history describes a larger business than the one you can buy. Honeywell, which misses the 20% bar on one measure, came through my first pass as a candidate and does not belong there for the same reason. It spun off its aerospace business on 29 June 2026 and now trades as a smaller automation company, while the annual report in my screen still includes aerospace. I was comparing this year’s price with last year’s company.
That leaves six. One of them, Maximus, runs benefit programmes for governments, is 36% below its high and is priced for no growth after growing 9% a year, and I have not studied it yet.
What the price believes
The other five are companies where the quality is real and the fear is one you can analyse. I add two that sit just outside the 19, Adobe and Zoetis, which clear the 20% bar on last year’s earnings and miss it on the five-year average, because the reverse DCF makes their case more clearly than the discount does. The growth rates in the chart are the generous version, set against five-year average earnings. Against last year’s earnings every one of the seven is priced for less.


Adobe is the textbook case. At about $225 it is 37% below its 52-week high and 65% below its three-year high. Its operating margin has averaged 32% over ten years and was 37% last year, its return on capital averages 29%, and revenue has grown about 13% a year for five years. Against its five-year average earnings the price assumes 4% growth. Against the roughly $8 billion it earned in the last twelve months the price assumes none at all, I get about $230 a share for an Adobe that never grows again. Meanwhile the company has bought back enough stock to take its share count from 452 million to 389 million in under three years. The whole question is whether Creative Cloud’s hold on professional workflows survives generative AI. If you have an informed view that it does, the stock is cheap. If you cannot form a view, it belongs in what Munger called the too hard pile, and that is a respectable place to leave it.
Cognizant stands for a whole group. Accenture, Genpact, Gartner, which is 68% below its three-year high, and Booz Allen Hamilton are all priced for little or no growth. The market has decided AI will shrink the billable hour across IT services and advisory. The test I would apply is who keeps the savings when AI does the work, the client or the firm doing the integration.
PayPal at $56.70 and H&R Block at $46.40 are priced for decline, about 1% and 4% a year. Here I do what Munger did and invert. For PayPal to be worth less than today’s price, branded checkout has to keep shrinking for a decade. For H&R Block, paid tax preparation has to erode faster than buybacks shrink the share count. If you cannot see that happening, the price is pessimistic.
Comcast is where the two lenses disagree most. On Graham’s lens it is very cheap, a 69% discount even on five-year average earnings. The reverse DCF says the market expects owner earnings to shrink about 12% a year for ten years, which is the market calling it a melting ice cube. The figures also flatter it, since last year’s owner earnings ran well above the average and the history includes the cable networks it spun off as Versant on 2 January 2026. I would call that value-trap territory until someone can explain why broadband pricing holds against fibre and fixed wireless.
Zoetis is a great business, with 34% margins, at a real discount, 57% below its three-year high. Verizon behaves more like a high-yield bond than a compounder.
What to do
- Read the implied growth, not the multiple. A P/E tells you what the market pays. Implied growth tells you what it believes, and a belief can be checked against the company’s history and your own knowledge of the industry.
- Name the fear. Right now most of the real discounts carry the same one, AI. Ask whether you understand that fear better than the market does, and if the honest answer is no, pass.
- Invert. Write down what would have to happen for today’s price to turn out too high. If the list is long and plausible, the stock is correctly priced for a risk you had not considered.
- Write the exit before the earnings report. Decide which results would make you walk away, then honour the list when the report arrives.
What the screen cannot say
Owner earnings at a fixed multiple ignores debt structure, growth and one-off items, which is why the judgement matters more than the ranking. The numbers are a snapshot taken during trading on 19 November, on a day the market fell 2%, and most fundamentals are from fiscal 2025. Where a company has sold or spun off a business since its last annual report, the history describes a different company, as it does for Honeywell, Solventum and Comcast, and nothing in the filings flags it. I left out 104 companies that report in other currencies and 151 issuers with no SEC financial data, mostly funds and trusts. The bigger gap is the companies the screen could not test. For 194 non-financial companies, Apple, Lululemon and the large homebuilders among them, a line was missing from the structured filings, usually debt, and 32 of those also show a 20% discount on both measures. So 267 and 19 are floors, not totals. Ten small lenders and mortgage trusts below the $2 billion line also slipped into the 1,734, none of which passes the quality test, and Hafnia’s figures are a fiscal year old.
The founders I work with are on the other side of this. A public company priced for no growth is a company whose customers are being told, every day, that software can now do what they pay people for. Some of that fear will prove right and some will prove wrong, and the difference will be decided by people building the products, many of them in companies as small as the ones we back here. If you are building in Iceland for the customers of Adobe or Cognizant, the market has already told you how much is at stake.
Sources and disclosure
- Lowest Forward 12-Month P/E Ratio for the S&P 500 in More Than 3 Years, FactSet, November 2026
- S&P 500 Forward P/E Falls to Three-Year Low, FX News Group
- S&P 500 Shiller PE ratio, Chartrow, 12 November 2026
- The last time the S&P 500’s valuation was this high, Motley Fool, July 2026
- Market Valuation: Expensive CAPE or Cheap PEG?, Advisor Perspectives, September 2026
- Company annual reports as first filed with the SEC (10-K, or 20-F for foreign issuers), fiscal 2025 for most companies
- Boyd Gaming fourth-quarter and full-year 2025 results, 5 February 2026
- Adobe’s quarterly reports (10-Q) through 28 August 2026 for the twelve-month figures
- Prices from Yahoo Finance, intraday on 19 November 2026
This is an exercise in a way of thinking and not investment advice, and nothing here is a recommendation to buy or sell any security. The screen uses methods I built for my own investment analysis. Founders Ventures, Blue Nova Ventures or I do not own any shares in the companies listed above.
Discover more from Startup Iceland
Subscribe to get the latest posts sent to your email.
